
What is Hammer Candlestick
Hammer Candlestick
Traders in the financial markets often make use of candlesticks as a great visual aid to analyse and monitor what a particular price has done within a certain time period. Candlestick patterns are the most flexible technical indicators to understand the market movements. The patterns can help traders gauge market sentiment for a certain financial asset. For instance, a hammer candlestick is a bullish pattern formed when the price of an asset declines from its opening price, reaching close to the support level, only to bounce back to close at a high.
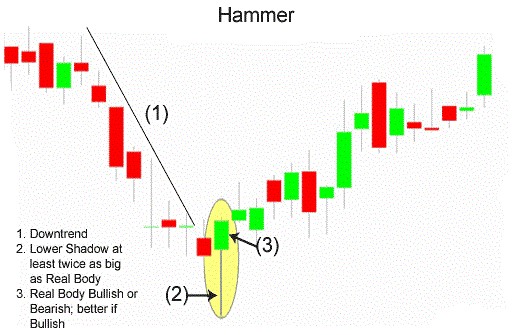
Talking of bullish candlesticks, a popular pattern is the hammer candlestick formation. A hammer is one of the more important reversal patterns that traders should be aware of. The hammer is treated as a bullish reversal, but only when it appears under certain conditions. The pattern normally forms near the bottom of downtrends, indicating that the market is attempting to define a bottom.
The hammer candlestick is found at the bottom of a downtrend and signals a potential (bullish) reversal in the market. A hammer is a candlestick pattern, when a stock opens then moves a lot lower during the day then rallies back near the opening price. The candlestick pattern looks like a hammer with the long lower wick from the lows of the day looking like the handle and the opening and closing price body form what looks like the hammer’s head. The lower wick is usually twice the size of the candle body but can be even bigger. To get the clear idea about Hammer Candle and how it look like please find the chart below..
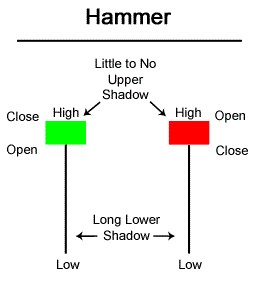
A bullish Hammer candlestick is formed when the high and the close are the same and it is considered a stronger formation because the bulls were able to reject the bears completely plus the bulls were able to push the price even more before the opening price.
The long lower shadow of the Hammer indicates that the market tested to find where support and demand were located. When the market found the support area, the lows of the day, bulls began to push prices higher, near the opening price. Thus, the bearish advance downward was rejected by the bulls.
Inverted Hammer
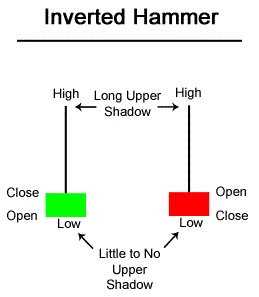
The Inverted Hammer candlestick formation occurs mainly at the bottom of downtrends
and can act as a warning of a potential reversal upward. It is important to note
that the Inverted pattern is a warning of potential price change, not a signal,
in and of itself, to buy. The Inverted Hammer formation, just like the Shooting
Star formation, is created when the open, low, and close are roughly the same price.
Also, there is a long upper shadow, which should be at least twice the length of
the real body. When the low and the open are the same, a bullish Inverted Hammer
candlestick is formed and it is considered a stronger bullish sign.
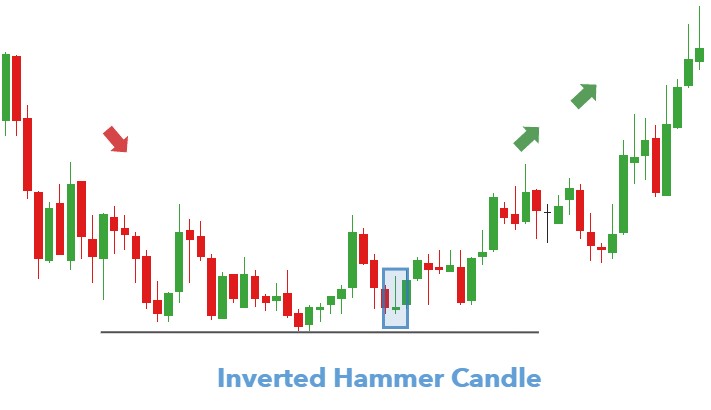
After a long downtrend, the formation of an Inverted Hammer is bullish because prices
hesitated their move downward by increasing significantly during the day. Nevertheless,
sellers came back into the stock, future, or currency and pushed prices back near
the open, but the fact that prices were able to increase significantly shows that
bulls are testing the power of the bears. What happens on the next day after the
Inverted Hammer pattern is what gives traders an idea as to whether or not prices
will go higher or lower.
- May act as a leading intraday indicator suggesting a shift in bullish/bearish momentum
- This indicator helps to either confirm or negate, a potential significant high or low has occurred. –price drives higher or lower “hammering” out a top or bottom before closing back towards open
- Significance increases with length of shadow (ideally 2-3 times the size of the body) as well as the timeframe
- Hammers may also help confirm, or strengthen, other reversal indicators (i.e. may occur as part of the tweezer formation, or next to doji, etc.)
- A hammer fails when a new high is achieved immediately after completion, and a hammer bottom fails if the next candle achieves a new low.
There is no assurance the price will continue to move to the upside following the confirmation candle. A long-shadowed hammer and a strong confirmation candle may push the price quite high within two periods. This may not be an ideal spot to buy as the stop loss may be a great distance away from the entry point, exposing the trader to risk which doesn't justify the potential reward.
Hammers also don't provide a price target, so figuring what the reward potential for a hammer trade is can be difficult. Exits need to be based on other types of candlesticks patterns or analysis.
| Hammer Candlestick | Doji |
|---|---|
|
|
|
|
- Is the hammer candlestick bullish or bearish?
- Which chart is the best for intraday trading?
- How does a hammer candlestick look like?
- What is the difference between hanging man and hammer candlestick?
- What are the advantages and disadvantages of hammer candlestick?
The hammer candlestick is a bullish reversal pattern made of just one candle. It occurs at the bottom of the downtrends.
Candlestick charts, volume charts, tick charts, point and figure charts, and Renko charts are some of the best charts for intraday trading.
A hammer candlestick is a type of bullish reversal candlestick having one candle in price charts of financial assets. The hammer looks like a long lower wick and a short body at the top of the candlestick with little or no upper wick.
If there is an upward trend in a chart indicating a bearish reversal, it is called the hanging man. If there is a downward trend indicating a bullish reversal, it is a hammer candlestick.
The hammer candlestick always indicates the reversal signal and exit signal. Investors can utilize these signals to close out of their short positions.