
Understanding Gann Theory in Stock Market
Understanding Gann Theory in Stock Market
Gann theory was a concept developed by William D. Gann in the 1900s. He was a successful trader and believed that stock prices change with an angle. An asset can move in different angles. He noticed that price changes were related to natural geometric shapes and predicted future price movements in relation to time. This is why Gann theory is also called the "Gann Angle theory"
Gann trading strategy can still be used and, if applied correctly, can predict the movement of an asset up to 90% accuracy. W. D. Gann believed that the market follows a natural time cycle. His theory was based upon natural geometric shapes and ancient mathematics.
Gann theory states that the patterns and angles of an asset on the market can be used as a predictor for the price's future movements.
W.D. Gann developed several unique techniques for analysing price charts. Gann believes that every angle and pattern has unique characteristics that can be used to predict price action. Gann's charts use the same time and price interval.
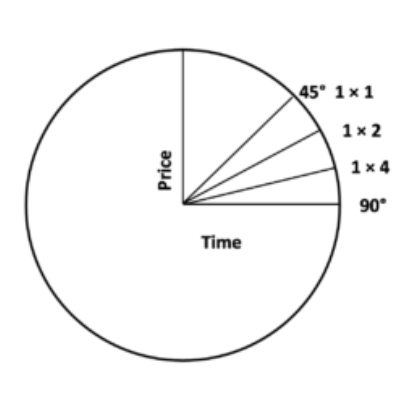
For Gann Angles rice/run of 1x1 will always equal 45-degree angle. Gann states that price and time are at their best when they rise or fall at a 45 degree angle relative to each other.
To draw Gann Angles at different angles, you need to have a significant top or bottom. If prices are above the trendline, it is a bullish market. A bear market if they are below. Gann believed that 1 x 1 trend lines provide major support and resistance in an up-trend, and that when it is broken it signals a major reversal of the trend.
Gann identified nine angles where the most important is the 1x1.
1) 1 x 8 - 82.5 degrees
2) 1 x 4 - 75 degrees
3) 1 x 3 - 71.25 degrees
4) 1 x 2 - 63.75 degrees
5) 1 x 1 - 45 degrees
6) 2 x 1 - 26.25 degrees
7) 3 x 1 - 18.75 degrees
8) 4 x 1 - 15 degrees
9) 8 x 1 - 7.5 degrees
Gann noted that all angles provide support and resistance levels based on the trend. Strong support is provided by the 1 x 1. It is a major signal of a reversal when the price begins to fall below the 1x1 angled trend line.
You can quickly grasp the basics of the subject with the help of gann anglesIntraday trading using the Gann Theory. Let's look at a simple example to understand the concept. If the market is in an upward trend and does not break, it means that the market will remain in an uptrend until the angle trend line breaks.
Gann theory can be useful to traders in order to make good returns on the market. There are many Gann theory books that you can find online or offline. The books can be used to help you trade.
We have provided basic concepts regarding the application of Gann Theory.
Patterns can be studied using both price theory and gann time.
1. Price Study With the help of Gann angles you can track the price movements of stocks. The pivot levels are used to predict the stock's future price movements. The stock price can also be determined by the resistance and support levels.
2. Time Study. Gann’s time study model gives traders an idea of when the stock's value can reverse. It is necessary to analyze historical data and determine the stock's current price. Gann's time study theory allows traders to estimate when the stock price can fall. To estimate this, it is necessary to examine the stock price movements over different periods.
3. Pattern Study: The use of patterns can help you find stock movements and investor activity. The pattern study covers the trends and patterns that indicate the reversal of stock movement.
This trading strategy was developed by Gann based on the assumptions.
1) Stock market movements are governed by a time cycle
2) Markets are geometric in their design and movement.
3) A market is only affected by price, time, and range.
Traders should remember that the market moves in different angles. These angles will remain the same. These angles can only be rotated.
An asset can move from one angle to the next. This is the "Rule of All Angles". This rule states that an asset moves from one angle to another once it has achieved an angle. Most commonly, Gann angles are used to locate support and resistance lines.
It is called break when support is broken. This indicates that the price will drop. It breaks out on the other hand. This means that resistance has been broken and the price will move down.
Once a trader has set his time frame, he/she will draw the Gann angles on the stock chart. These angles can be 1X1, 2X1, 3,X1, 3X1, 1,X2, 1,X3, and so on. These lines can be used to determine the need of the trader and then they are used to interpret the price movement.
Note: Support angles that are uptrending indicate support, while downtrend angles indicate resistance.
Sometimes, a combination of horizontal and angles is used to determine support or resistance. If a stock is bullish, it may retrace to 50%. This level will serve as support for the stock.
However, if the stock is bearish, the 50% retracement level is an important resistance level. These angles are important support and resistance levels for assets that have been trading at different angles. These areas are also called price clusters.
- How to draw Gann angles at different angles?
- What is pattern study in application of gann theory?
- What does Gann theory states?
Gann Angles at different angles, you need to have a significant top or bottom. If prices are above the trendline, it is a bullish market. A bear market if they are below. Gann believed that 1 x 1 trend lines provide major support and resistance in an up-trend, and that when it is broken it signals a major reversal of the trend.
The use of patterns can help you find stock movements and investor activity. The pattern study covers the trends and patterns that indicate the reversal of stock movement.
Gann theory states that the patterns and angles of an asset on the market can be used as a predictor for the price's future movements.
Conclusion
Gann theory is an important technical analysis tool that traders use. These nine special numbers are used to set stop loss and targets for trades based on the LTP (last traded price).
These targets can be calculated on a variety of websites, as well as your stop loss. These targets can be bullish or bearish. A trader must decide which targets to pursue.
If used correctly, Gann trading strategies using Gann indicators can lead to many successful trades. Gann theory is only successful when applied correctly. This requires time and experience.
This theory will help you to analyze the market and predict future stock price movements. It is crucial to always backtest your strategy and put a stop loss in every trade.