Go To Odin Installation
You can get your Trading ID from the Welcome Email sent by Nirmal Bang.

Mail would be from welcomeletter@nirmalbang.com,Please check your junk folder also. Trading Code in that letter is your Login ID for any trading application of Nirmal Bang. This mail will not contain password, For password you will receive one mail from support@nirmalbang.com for 1st time only, subject of this mail is “Reset Password” OR

User has to generate password through trading application.

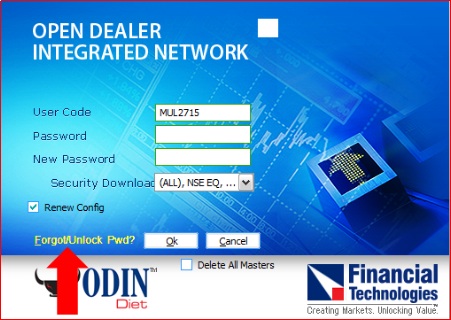
How to generate password?

Open Odin Application, On login window click on Forgot/Unlock Pwd?

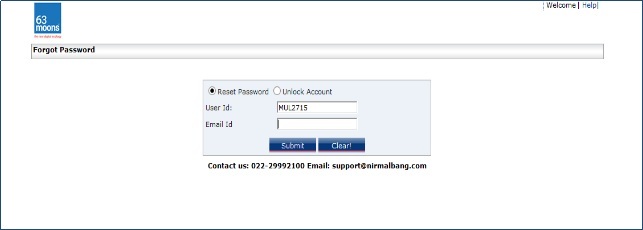
Put your login id and registered Email id and click on submit

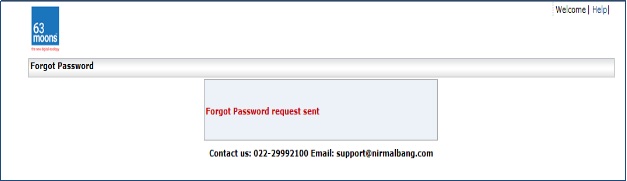
You will receive system generated password on your registered mail and text message on mobile. If you are checking mail, mail is from

support@nirmalbang.com and subject of mail is Reset Password

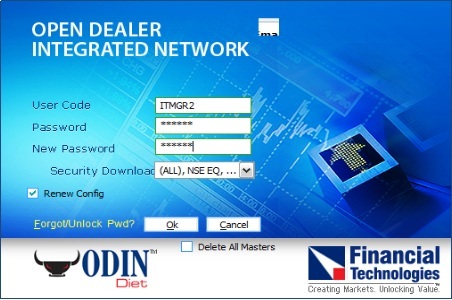
Put password you received on mail or Mobile, in new password put your new password (The password must be Alpha numeric with a minimum of 6 & maximum 12 characters in length. Space is not a valid character in the password. Special character is allowed in password) then click on Ok

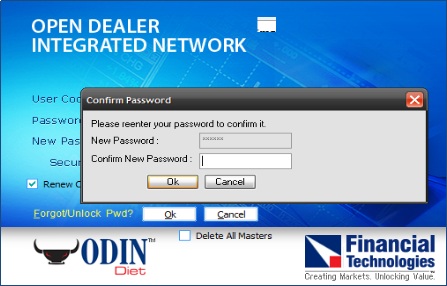
Confirm new password and click on Ok. It process further and will get following window:

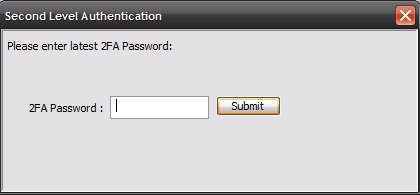
Put your registered PAN number or registered mobile number as 2FA Password.

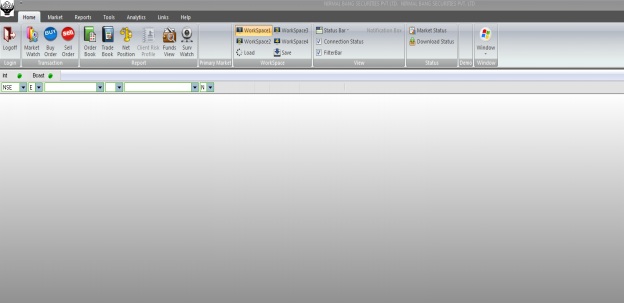
You are logged in successfully.

Market Watch enables viewing detail market information of equities and derivatives on a continuous basis. Further, it enables displaying a predefined profile by default and browse required market details. ODIN™ Diet facilitates creating highly parameterized and customizable market details. A customized column display can be saved for future use or even made as the default display. On applying a Portfolio, placing of orders is also supported from within Market Watch window.

When you logged in to the Odin default screen will be there as in below image :

Click on market watch symbol pointed by red arrow or press F4.

Market watch window will be open as in below image :

Right click anywhere in market watch window, select Scrip Portfolio,

Many default portfolios will be there, select any one you want and click on apply; applied portfolio will be there in Market watch as in below image :

In market watch, check the options as shown in red rectangle, Select Exchange, Select Instrument Type, Enter Symbol or select from a list displayed, Select Series And press enter key.

Select scrip you want to delete and press delete key or right click on selected scrip and select delete option.

The trading activity begins by placing orders for the required scrips. Dealing with orders in ODIN™ Diet is an easy task and a key-press activity. ODIN™ Diet provides explicit order entry windows for the various market segments invoked using shortcut key combinations. Further, an Order Book displays entire orders placed for the day chronologically along with their current status.

The basic methodology of placing orders is simple, quick and easy. Placing of orders can be done within the Market Watch or directly inputting values in order entry pane. Depending on order type - buy/sell - the background of order entry pane is changed. The Blue background implies a Buy Order Entry and a Red background indicates a Sell Order Entry. ODIN" Diet provides separate panes for Cash Order Entry, Derivatives Order Entry and even Fast Order Entry.

The pending orders can be modified or canceled, if required and simultaneously the Order book is updated.

Select require script you want to buy, press F1 key or click on Buy Order symbol

Order entry window will be open, put your require parameter and submit the order.

Place Sell orders window submits Sell orders in equity market. For placing orders, select a security in Market Watch or directly enter appropriate values for order in the Order Entry.

Select require script you want to sell, press F2 key or click on Sell Order symbol.

Order entry window will be open, put your require parameter and submit the order.

Orders Book provides information regarding orders placed and status of the orders for all instruments. Orders Book pane is used For viewing, modifying, and canceling buy/sell orders.

Press F3 key or Click on Order book symbol to open order book window.

Right-click inside the Orders Book. Select Filter from the various right-click options available.The Order Filter window is displayed.

By default, it displays Orders from all Instrument Types.

As required, apply conditions in filter and accordingly, the conditional output is displayed.

Out of all orders in order book we can modify pending orders only, Highlight the order to modify/cancel. Right-click and select Modify/Cancel. Alternatively, to modify orders Click Orders>Modify/ Shift + F2. To cancel orders, Click Orders>Cancel/Shift +F1

As required, modify/cancel the details. Click OK.To cancel all orders, Click Orders>CancelAll/Shift +F3.

A Buy or Sell order placed but which is yet to be executed is called pending order. Once an order is executed, it is a trade.

* Pending Order – Buy Limit Order Example

A Buy limit order where the buy price would be lower than the Current Market Price would have an order status as pending since the Buy price and the Current Market Price do not match. Once they match, the pending order will be executed. The execution of the order can be partial or complete depending on the quantities matched.

For Example, If you place an order to Buy Reliance @ Rs. 1015 but the Current Market Price is Rs. 1021 then, the order will show as pending unless the Market Price falls to or below Rs. 1015.

* Pending Order – Sell Limit Order Example

Similarly, a Sell Limit Order where sell price is more than the Current Market Price would be pending until the pricesmatch.

For Example, If you place an order to SELL Reliance @ Rs. 1015 but the Current Market Price is Rs. 1001 then, the order will show as pending unless the Market Price rises to or above Rs. 1015.

This happens because exchanges follow a price time priority system for matching orders against each other.

Net Position displays the open positions in Equity and Derivatives markets. ODIN™ Admin also supports squaring off the positions

From the Net Position window as and when required. You can also view daily and expiry periodicity.

To view Net Position click on Net Position symbol or press Alt+F6 keys.

Trade book displays all executed trades. To see trade book, click on Trade Book or press F8 key.

Funds View displays the funds allotted for different segments.

Click on fund view symbol to open fund view window.

Following window will open

From drop down option select Periodicity/Exchange as you want and click on submit.

To Broker Account in Fund transfer facilitates to increase the Limit/Exposure of trading by online transfer of payment to Broker.

* Features

Quicker method to transfer money

Increase limit sets for various markets at a same time

For fund transfer click on links option then click on Back Office symbol.

Following page will open, click on fund transfer option

You will be directed to below page.

Put your login ID as Username and PAN number as Password and sign in,

Put your details and Amount and Submit, you will be directed to your bank login page, then complete the process

For payout click on links option then click on Back Office symbol.

Following page will open, click on PAYOUT option

You will be directed to below page. Select exchange type and click on GO

Below page will open, Select all options like Mode of payment, Client Bank, Amount etc. then click on save.

Amount will be credited in clients account.

Stock Watch provides the status of the Depository. It includes details such as your current Depository Participant balance at theStart of the day. This would be enabled only if the member has availed the DP license.

To view stock, click on reports then click on stock holding.

You can sell stocks directly from stock watch window too.

To see Best Five of any script, select the scrip and press F5 key.

Chart provides graphical representation of scrip prices along with accompanying indicators and Price Styles.ODIN Charts consistof Basic and Advanced Types.

To see Intraday chart of particular script, select the script right click on it and select Intraday Chart option or pressCtrl+i key

To see Historic chart of particular script, select the script right click on it and select Historic Chart option or press Ctrl+H key.

Market Movement displays market trends of scrips on real-time basis. The information is displayed at a time interval of maximum 50 minutes and minimum 1 min.

To view, click Market>MarketMovement>MarketMovement (Equity). Alternatively, press Shift + F12.The Market Movement window is displayed along with the filter.

Specify the filter conditions, as required.

Click OK. Accordingly the details based on filter conditions are displayed in Market Movement window.

Snap Quote displays real-time market information of scrips based on their instrument types. The Blue colors signify a buy priceand sell quantity; Red color signify a sell price and sell quantity. However, only a single Snap Quote window can be invoked at a time.

The information displayed in the Snap Quote window for a particular contract is same as that in the Market Watch window.

Click Market>SnapQuote (Equity). Alternatively, press Shift+F9 to open Snap Quote.

open your trading account
Please fill in your details Registration closes in 10.00Minutes!

(You will receive a Call & SMS from our end)

freedemat account opening rs5,00,000 personal accident insurance * rs50,000 accidental mediclaim *

© NIRMAL BANG. All rights reserved

Designed , Developed & Content Powered by Accord Fintech Pvt. Ltd.

Open an Account
FOR AFREE *DEMAT & BROKING ACCOUNT

Please fill in the details below

Close X

(Note - You will receive a call from our sales executive)

CLOSE X

RISK DISCLOSURES ON DERIVATIVES

  • 9 out of 10 individual traders in equity Futures and Options Segment, incurred net losses.
  • On an average, loss makers registered net trading loss close to ₹ 50,000.
  • Over and above the net trading losses incurred, loss makers expended an additional 28% of net trading losses as transaction costs.
  • Those making net trading profits, incurred between 15% to 50% of such profits as transaction cost.

Source:

1. SEBI study dated January 25, 2023 on “Analysis of Profit and Loss of Individual Traders dealing in equity Futures and Options (F&O) Segment”, wherein Aggregate Level findings are based on annual Profit/Loss incurred by individual traders in equity F&O during FY 2021-22.